The JIT compiler is the heart of the Java Virtual Machine(JVM). It improves the performance of Java applications at runtime. Nothing controls the performance of your application more than the JIT compiler.
Nowadays we don’t normally need to tune the JIT compiler due to popularity of Microservices framework like Spring Boot, but in my opinion it is still good to know how things work under the hood. The following picture gives an overview of how the JIT compiler fits in Oracle HotSpot JVM.
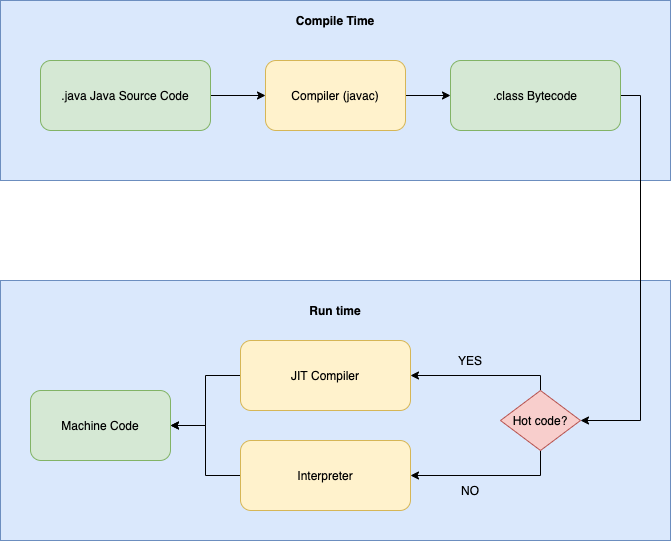
As you can see, Javac compiler compiles Java source code into an intermediate low-level language (Java Bytecode), which is then run by the java binary. The Java Bytecode cannot be executed by CPUs directly so it will need to be further compiled/interpreted into machine code. And this is where JIT compiler kicks in. When executing Bytecode, the java program is able to compile the code into platform binary as the code executes. That’s why it is called “just in time”.
When the JVM executes code, it does not begin compiling the code immediately. There are two reasons:
- Firstly, if the code is going to be executed only once, then compiling it is essentially a wasted effort; it will be faster to interpret the Java bytecodes than to compile them and execute (only once) the compiled code.
- Secondly, the more times that the JVM executes a particular method or loop, the more information it has about that code. This allows the JVM to make numerous optimizations when it compiles the code. The JVM will create compiled code that deals with uncertainty which will involve deoptimizing and then reoptimizing the code in question.
On-Stack Replacement
JIT compilation is an asynchronous process: when the JVM decides that a certain method should be compiled, that method is placed in a queue. Rather than wait for the compilation, the JVM then continues interpreting the method, and the next time the method is called, the JVM will execute the compiled version of the method. But consider a long-running loop. The JVM will notice that the loop itself should be compiled and will queue that code for compilation. But that isn’t sufficient: the JVM has to have the ability to start executing the compiled version of the loop while the loop is still running—it would be inefficient to wait until the loop and enclosing method exit (which may not even happen). Hence, when the code for the loop has finished compiling, the JVM replaces the code (on stack), and the next iteration of the loop will execute the much faster compiled version of the code. This is called on-stack replacement (OSR).
Tiered Compilation
JIT compiler used to have two flavours: client and server compilers. As the name indicates, client compiler (C1) is used for client side applications while server compiler (C2) is used for server side applications. The primary difference between the two compilers is their aggressiveness in compiling code. The C1 compiler begins compiling sooner than the C2 compiler does. This means that during the beginning of code execution, the C1 compiler will be faster. However, C2 compiler makes better optimizations in the compiled code using the knowledge it gains while it waits. Ultimately, code produced by the C2 compiler will be faster than that produced by the C1 compiler. Tiered compilation comes into play by making the JVM start with the C1 compiler and then use the C2 compiler as code gets hotter.
Deoptimization
Deoptimization means that the compiler has to “undo” a previous compilation. The effect is that the performance of the application will be reduced—at least until the compiler can recompile the code in question. Deoptimization occurs in two cases: when code is made not entrant and when code is made zombie. When the compilation log reports that it has made zombie code, it is saying that it has reclaimed previous code that was made not entrant.
Code Cache
When the JVM compiles code, it holds the set of assembly-language instructions in the code cache. The code cache has a fixed size, and once it has filled up, the JVM is not able to compile any additional code. There really isn’t a good mechanism to figure out how much code cache a particular application needs. Hence, when you need to increase the code cache size, it is sort of a hit-and-miss operation; a typical option is to simply double or quadruple the default.
In Java 11, the code cache is segmented into three parts:
- Nonmethod code
- Profiled code
- Nonprofiled code
By default, the code cache is sized the same way (up to 240 MB), and you can still adjust the total size of the code cache by using the ReservedCodeCacheSize flag.